Dec 022015
With some of the data that I’ve been polling recently, I decided to make a little dashboard for myself for home use.
This dashboard uses some custom screens to display the data that I wanted.
The screens consist of the following –
ADSL Stats
Local Fuel Prices
Local News + Local Weather
National News + Local Weather
World News + Local Weather
This way, I could have a Zabbix slideshow that rotates between these 5 screens on display near my desk, to allow me to keep an eye on my ADSL stats for example.
Here are some screenshots of my ADSL and Fuel price screens –

My ADSL Stats Screen on my Dashboard
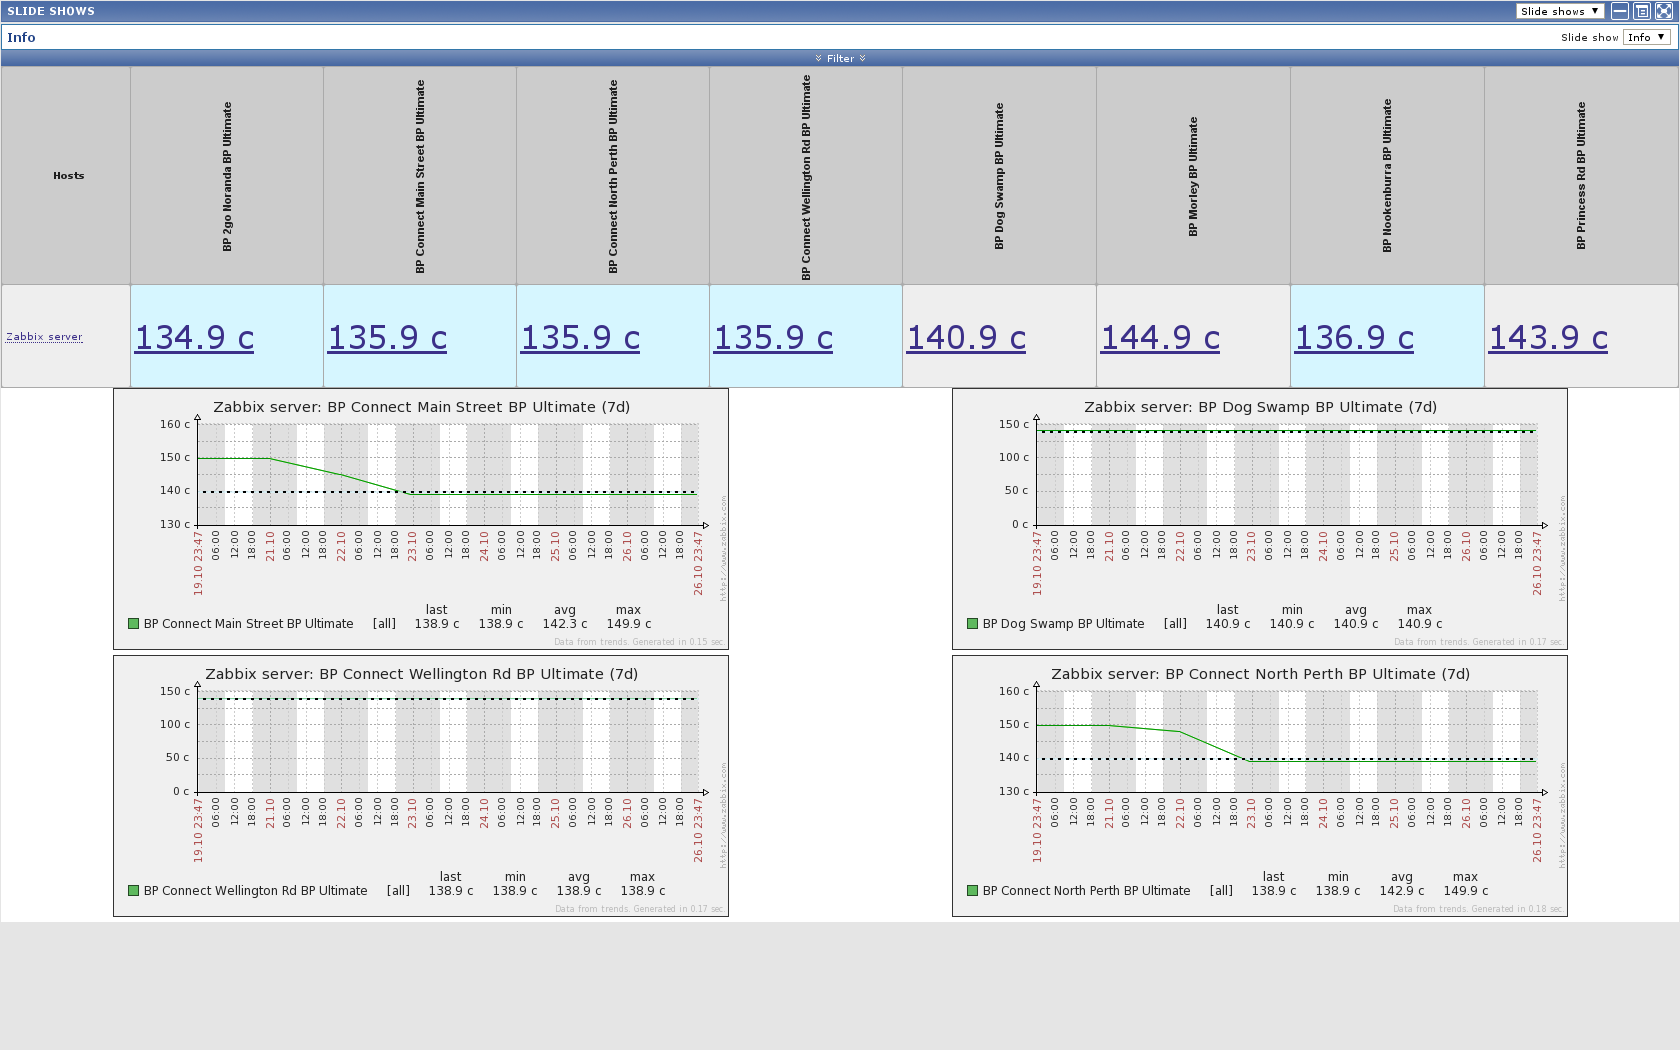
My Local Fuel Prices, with some historical graphs

This is my WA News screen. The National and World News screens are pretty much the same.

Very impressive. I have played with zabbix only a little bit and I just don’t seem to be able to get my head wrapped around it. I have nagios monitoring a ton of stuff, but no graphs 🙁
Again. Very nicely done
Thanks!