I recently had a thought…I wonder if Zabbix can graph the fuel prices near me.
This thought was triggered by a news article I read about how the petrol station cycles have changed so that the cheapest fuel is on a Monday rather than a Wednesday like it used to be.
Since I already had a Zabbix install going, I had no desire to install any other graphing engine and whatnot just to graph some simple numbers, so I came up with a way to graph the local fuel prices with Zabbix. Not really the intended use case of Zabbix, but hey, it worked!
This could be applied to any number of situations where a number online needs graphing and you already have Zabbix going, but I’m using local fuel prices as a real world example.
For my petrol graphing needs, the Western Australian Government conveniently provides a service called Fuelwatch that provides a “RSS feed” that I can use to retrieve the prices for today. I built a small Python script that allows me to pull the price of fuel for any petrol station, which I then use with the Zabbix agent’s system.run functionality to pull in numbers.
I’ve used the Zabbix server for my scripts since that’s one of the few servers where I have the Zabbix agent installed. I put the script named prices.py into /opt/scripts, and then created a Zabbix agent active item with the following key –
system.run[/opt/scripts/prices.py "BP 2go Noranda"]
This means “Run the script /opt/scripts/prices.py with the parameter BP 2go Noranda”, which then pulls the price for BP Ultimate into Zabbix.
The script will return a number similar to this one – 150.9 – so I’ve set the Type of information for the item to “Numeric (float)” so I can capture the decimal place. This results in a graph like this –
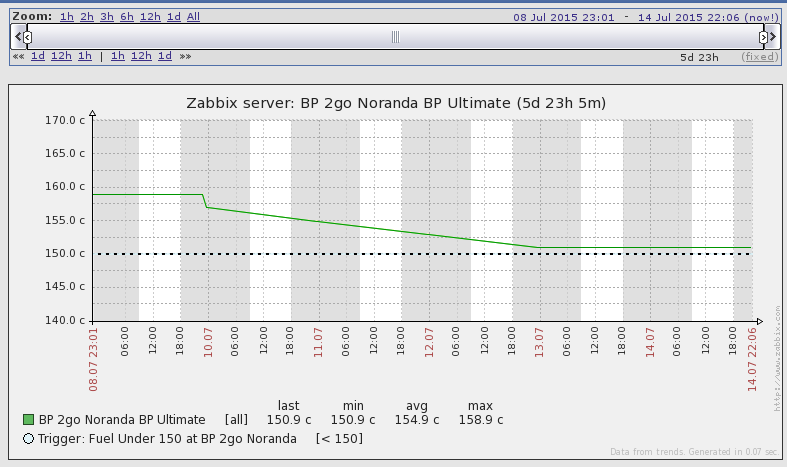
The result of graphing the price for a few days
You could then potentially set up a graph with multiple items and compare values, or just have history like what I have.

I am trying to do something similar with a python script but how did you actually graph the result with Zabbix? Would this work for a set returned by the script for example , for multiple items?
To graph it, I just created a graph on the host that polled the XML file with all the items I configured. The items all had floats for the item type so Zabbix could easily do line graphs of the items.
Sets might be a bit harder, I’m not sure how Zabbix would handle that. What’s your use case?