I wanted to monitor the ntpd and python processes on one of my servers so that I would know if one of them went down.
I already had Zabbix and SNMP monitoring setup on this server so decided to have a play around with SNMP Process monitoring.
Configuring the SNMP Daemon
The Linux SNMP daemon already has some examples of process monitoring so I just commented out the existing ones, and added my own.
Since I only care that ntpd and python are running, I just added the following lines to my SNMP configuration to ensure that at least one of each of these processes are running
proc ntpd

proc python
Once the lines have been added, the SNMP daemon needs to be restarted to load the new monitoring parameters. You can check to see if the monitoring has been enabled by running the following SNMP walk command –
snmpwalk -v 2c -c [YOUR COMMUNITY STRING HERE] [YOUR HOST HERE] 1.3.6.1.4.1.2021.2.1
As an example, I’ve run the following command and I get this output –
# snmpwalk -v 2c -c public myserver 1.3.6.1.4.1.2021.2.1

UCD-SNMP-MIB::prIndex.1 = INTEGER: 1

UCD-SNMP-MIB::prIndex.2 = INTEGER: 2

UCD-SNMP-MIB::prNames.1 = STRING: ntpd

UCD-SNMP-MIB::prNames.2 = STRING: python

UCD-SNMP-MIB::prMin.1 = INTEGER: 1

UCD-SNMP-MIB::prMin.2 = INTEGER: 1

UCD-SNMP-MIB::prMax.1 = INTEGER: 0

UCD-SNMP-MIB::prMax.2 = INTEGER: 0

UCD-SNMP-MIB::prCount.1 = INTEGER: 1

UCD-SNMP-MIB::prCount.2 = INTEGER: 1

UCD-SNMP-MIB::prErrorFlag.1 = INTEGER: noError(0)

UCD-SNMP-MIB::prErrorFlag.2 = INTEGER: noError(0)

UCD-SNMP-MIB::prErrMessage.1 = STRING:

UCD-SNMP-MIB::prErrMessage.2 = STRING:

UCD-SNMP-MIB::prErrFix.1 = INTEGER: noError(0)

UCD-SNMP-MIB::prErrFix.2 = INTEGER: noError(0)

UCD-SNMP-MIB::prErrFixCmd.1 = STRING:

UCD-SNMP-MIB::prErrFixCmd.2 = STRING:
From the output above, you can see the Names, Minimum number of processes, Maximum number of processes, the current count of processes, the error flags and messages, and then also a flag to set whether to run the command specified in the ErrFixCmd OID.
Configuring Zabbix
In Zabbix, I’ve setup a Low Level Discovery (LLD) template for process discovery and monitoring. This saves me from having to create items for each and every SNMP process monitor, even though at the moment I only have 2 processes to monitor. Creating the template will allow me to assign the template to more hosts to monitor more processes!
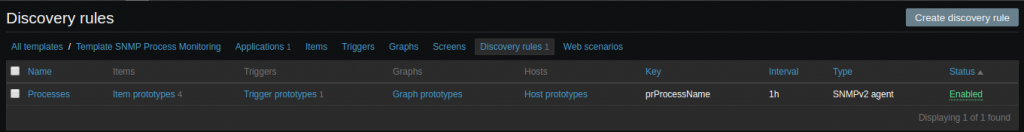
I’ve created a template named Template SNMP Process Monitoring to keep with the stock naming convention. Under the template, I’ve got an Application named Processes to assign item prototypes to.
For the Discovery Rules, I’ve created a Processes rule to create item and trigger prototypes.
Under the Item Prototypes, you can see the 3 SNMP item prototypes I’m using to discover what processes are being monitored.
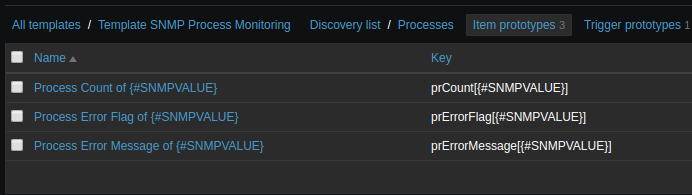
You can see the Keys I’ve used here for the item prototypes, I’ve tried to keep to the same terminology used for this particular OID that we’re monitoring
Each item prototype is pretty easy to configure. The only thing that changes between all 3 items is the OID, the Key, and the possibly the data type.
I’ve created a table below for easy reference when you’re creating the item templates.
The key can be changed, I’ve just used the same names as the OID table. The SNMP OID can also be changed to use the name rather than OIDs.
| Name | Key | SNMP OID | Item Type |
| Process Count of {#SNMPVALUE} | prCount[{#SNMPVALUE}] | 1.3.6.1.4.1.2021.2.1.5.{#SNMPINDEX} | Numeric (unsigned) |
| Process Error Flag of {#SNMPVALUE} | prErrorFlag[{#SNMPVALUE}] | 1.3.6.1.4.1.2021.2.1.100.{#SNMPINDEX} | Numeric (Unsigned) |
| Process Error Message of {#SNMPVALUE} | prErrorMessage[{#SNMPVALUE}] | 1.3.6.1.4.1.2021.2.1.101.{#SNMPINDEX} | Text |
The rest of the settings are dependent on your own environment/configuration. Once the discovery is complete, you should be able to check the monitoring via the Latest Data values.
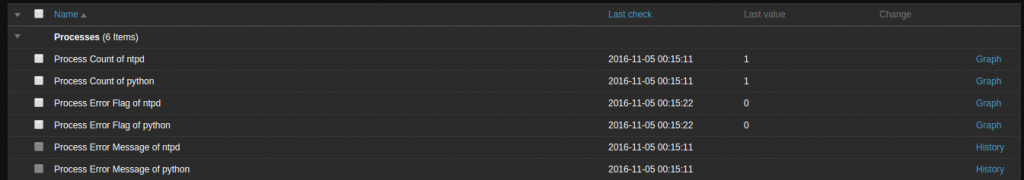
The Latest Data view shows that I don’t have any issues with the processes at the moment

what you have type in SNMP OID filed of Process discovery rule?
and what values in trigger?
SNMP OID is something you can define yourself in the snmp configuration file.
I don’t have any triggers for my process monitoring at the moment.
Any chance you could post this template at Zabbix Share? – https://share.zabbix.com/
It would be of great use to a lot of people.
Will do!
Hello, can you help me ? Can you describe, how to set up trigger ???