In the previous post, I got the Raspberry Pi outputting the values from the temperature sensors via SNMP.
In this post, I’ll be configuring Zabbix to monitor and record these values so that I can see how cold it was last night.
You’ll need to note down the OIDs that were configured on the SNMP agent in the last post so you can use them in this post.
Monitoring the Pi
Adding it in
The Raspberry Pi will need to be monitored in some way by Zabbix in order for us to record the temperatures from the SNMP agent that we’ve set up.
You’ll need to add the Raspberry Pi as a host in Zabbix, and give it an IP address under the SNMP interfaces section. I’ve added the SNMP OS Linux template to monitor the rest of the Pi stats, but that’s not required for monitoring temperatures.
Creating the Temperature Item
Once the Pi is monitored, we’ll need to create an item for each sensor. I have 3 sensors hooked up to my Pi but I’ll only set up one in this blog post as the other 2 will be setup in the exact same way.
In the Items section for your Raspberry Pi host, create a new item.
Give the item a name, I’ve used Temperature of ce50ff (intake) as a name, this is so that I know which sensor this is, and what role the sensor is playing – in this case it’s sensor 28-021500ce50ff and it’s measuring the server intake air temperature.
For the key, I’ve used TempSensor-ce50ff, this is to match it up with the sensor ID as the key needs to be unique.
For the SNMP OID, you will need to customise this to your own setup. I have used .1.3.6.1.3.1.1.4.1.2.5.116.101.109.112.49.1 for my Pi as that’s the OID that returns the temperature value of the sensor.
I found this with a SNMP walk of the base OID that is set up in the SNMP agent configuration.
I used the last line in the snmpwalk, however there are 3 OIDs that all return the same thing so any of those should be OK to use.
I use a Macro for my SNMP community string, however you’re free to hard code the community string here.
For the Type of information, I’ve used Numeric (float) so that I can get the full precision of the sensor.
I’ve set Units to 'C to indicate degrees Celsius, and I’ve also set a custom multiplier of 0.001 to get the decimal point to the correct location for the sensor reading.
The final configuration looks something like this –

The rest of the settings are up to you to define, I’ve used defaults for most of it. After the item is created, we should be able to check the Latest Data section for the Pi, and see the data coming in from the sensor.
Incoming Temperature Data
Creating a Graph
Since there’s not much use of data being recorded but not being displayed, we’ll create a graph to display the data on.
On the Raspberry Pi host, click on the graphs link to open the graphs page, and then click on the Create Graph button.
Give the graph a name, and add in the sensor items you created previously.
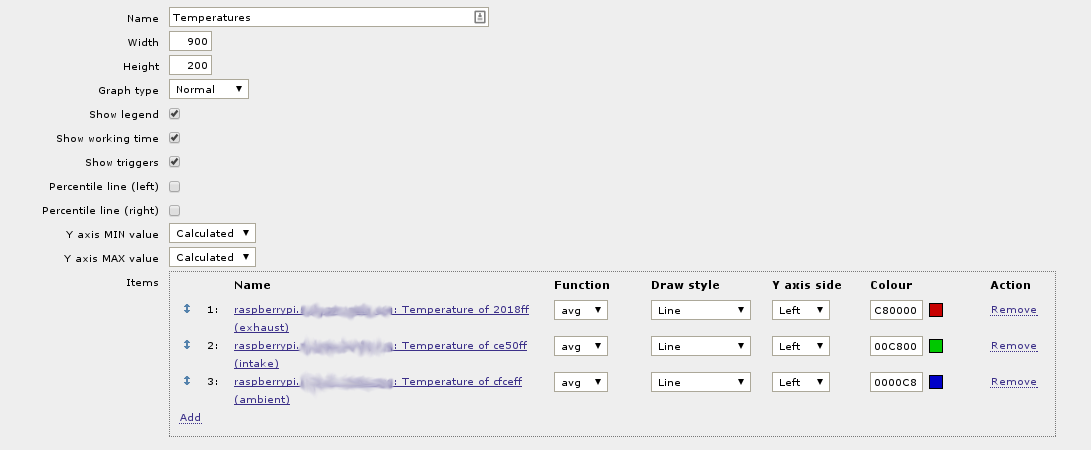
I’ve used all 3 sensors on this graph
Once the items have been added in, click on the Save button to save the graph.
Give Zabbix some time to go through some polling cycles, and you should get a graph of the temperature data from the sensors.
I’ve run the sensors for about a day now and here’s the resulting graph:
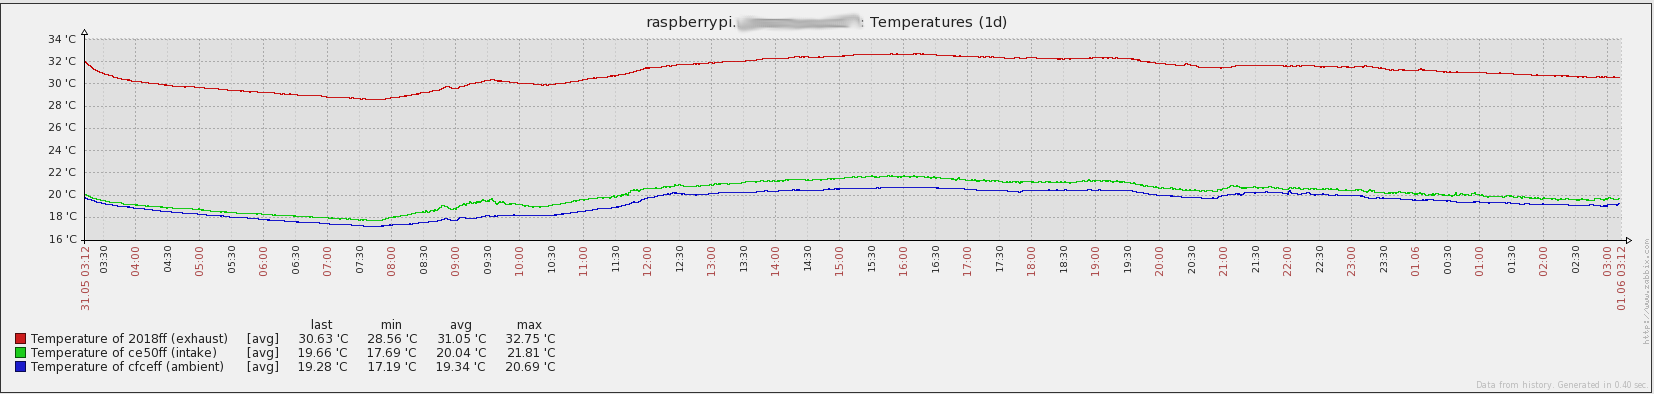
Temperature Graph over a day
With this data, you could then also set up triggers if things go over or under a certain temperature. These triggers could then do things like send emails, start fans, start heaters etc.
This is just the start of what you could do with Zabbix and a Raspberry Pi!
