May 182015
 

One of my current projects at work is to build up Zabbix as an alerting solution.
This includes using Zabbix to raise incidents in ServiceNow for any alerts that come through.

Initially, I thought that I would need to do lots of scripting, but it turns out I only had to write a simple script to allow Zabbix to raise incidents in ServiceNow.
This was largely thanks to pre-built Python modules that the community have built to allow easy integrations, namely ZabbixAPI and Python-Servicenow.

These 2 libraries made integration easy because they allowed me to concentrate more on the code to join the 2 systems rather than having to figure out how to make them talk to Python, and then talk to each other.

The integration itself will take an alert that is generated by Zabbix and insert the data into ServiceNow as an incident.

Configuring Zabbix

  1. Copy the snippet at the bottom of this post into a file in /usr/lib/zabbix/alertscripts. I’ve named mine servicenowapi.py.
  2. Create a new Media Type.
    Create a new media type by going to Administration => Media types, and click on Create media type.
    Give the Media Type a name, select Script for the Type, and put in the name of the file. Using my example, it would be servicenowapi.py
  3. Assign the new Media Type to a user.
    The user’s “Send to” for the media type will define the assignment group in ServiceNow.
    Click on Administration => Users, select Users in the drop down on the top right, and click on a user. Once you’re in the user’s configuration page, click on the Media tab, and then click on ‘Add’.
    Select the new Media Type from the type drop down, and then enter in the ServiceNow Assignment Group in the ‘Send To’ box, and click ‘Add’.
  4. Create or modify an existing action to start sending incidents to ServiceNow.
    Click on Configuration => Actions, and open up an Action. Click on the Operations Tab, and click on “New”.
    Click on “Add” in the Send To Users section, and choose the user that has the ServiceNow Media type set up.
    Select the ServiceNow action in the “Send only to” box, and then click on the “Add” button to add the action to the list of actions.
    Once the action has been setup, click on Save.

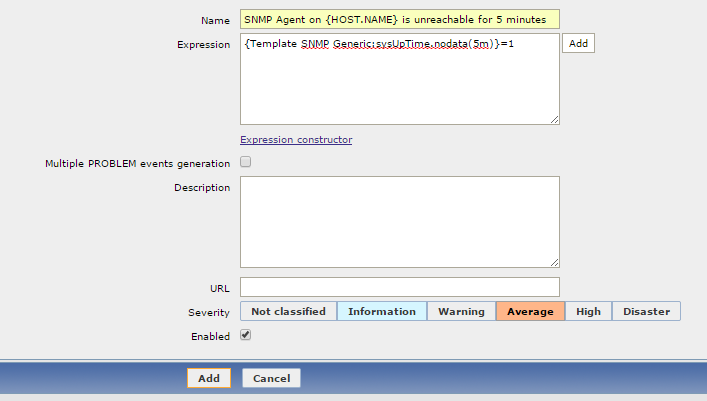
Once the alert is all set up, whenever the alert is triggered, the script should log an incident directly into ServiceNow.

servicenowapi.py

The below code should be copied and pasted into a file to be used as the script for the Media Type.

#!/usr/bin/python
import zapi
import datetime
import sys
import urllib2
import os
import servicenow.Connection
import servicenow.ServiceNow

##
## I've used logging for my own setup, but I've commented it out so that it won't spam a log file unless you uncomment it.
## Just make sure the location that you're storing the logfile is writable by the zabbix user
## In this example, I've used /usr/lib/zabbix/logfiles but this could be anywhere writable by the zabbix user
#f = open('/usr/lib/zabbix/logfiles/snow.log','a')
#f.write('\n\nScript Start :: '+datetime.datetime.now().ctime()+'\n\n')
#f.write(','.join(sys.argv)+'\n')

## Zabbix Passes the details via command line arguments.
assignmentgroup = sys.argv[1]
description = sys.argv[2]
detail = sys.argv[3]

## Set Up your Zabbix details
zabbixsrv = "127.0.0.1"
zabbixun = "Admin"
zabbixpw = "zabbix"

## Set up your ServiceNow instance details
## For Dublin+ instances, connect using JSONv2, otherwise use JSON
username = "username"
password = "password"
instance = "instance"
api = "JSONv2"

## I've configured Zabbix to only pass the Event ID in the message body.
## If you want more detail in the body of the incident in ServiceNow, you'll need to make sure that eventid is parsed out of detail correctly.
eventid = detail

#f.write('trying to connect to servicenow\n')
try:
conn = servicenow.Connection.Auth(username=username,password=password,instance=instance, api=api)
except:
print "Error Connecting to ServiceNow\n"
#f.write("Error Connecting to ServiceNow\n")

#f.write('trying to create incident instance\n')
try:
inc = servicenow.ServiceNow.Incident(conn)
except:
print "Error creating incident instance\n"
#f.write("Error creating incident instance\n")

#f.write('trying to create new incident\n')

## This is where the fun starts.
## You'll need to set up the following section with the correct form fields, as well as the default values
try:
newinc = servicenow.ServiceNow.Incident.create(inc, { \
"short_description":description, \
"description":detail, \
"priority":"3", \
"u_requestor":"autoalert", \
"u_contact_type":"Auto Monitoring", \
"assignment_group": assignmentgroup})
#f.write("\n\n"+str(newinc)+"\n\n")
except Exception as e:
print "Error creating new incident in ServiceNow\n"
print str(e)
#f.write("Error creating new incident in ServiceNow\n")
#f.write(str(e)+"\n")

## This script will retrieve the new incident number from servicenow and put it back into zabbix as an acknowledgement
try:
newincno = newinc["records"][0]["number"]
except:
print "unable to retrieve new incident number\n"
#f.write("unable to retrieve new incident number\n")

zabbix = zapi.ZabbixAPI(url='http://'+zabbixsrv+'/zabbix',user=zabbixun,password=zabbixpw)
zabbix.login()
#f.write('Acknowledging event '+eventid+'\n')
zabbix.Event.acknowledge({'eventids':[eventid],'message':newincno})

#f.write('\n\nScript End :: '+datetime.datetime.now().ctime()+'\n\n')
#f.close()

Share
May 112015
 

I never noticed this before since I didn’t use Zabbix for production monitoring, but Zabbix out of the box does not have any alerts set up to tell you that an SNMP agent is unresponsive.
This isn’t an issue if you’re doing monitoring using the Zabbix Agent, or just monitoring server ups and downs, but when you’re using Zabbix to gather metrics such as CPU and Memory usage, this can become an issue.

The solution is to create a trigger for SNMP hosts to alert when Zabbix does not get any data for more than a certain amount of time.

Creating the trigger

I’ve chosen to create the trigger on the Template SNMP Generic template so that all SNMP devices will get this trigger.
To create the trigger, click on Configuration ==> Templates, and then find Template SNMP Generic. To the right, click on Triggers
Once the Triggers page has loaded, click on Create Trigger in the top right.
Give the trigger a name, and use the following Expression {Template SNMP Generic:sysUpTime.nodata(5m)}=1
Trigger Configuration
Optionally, give it a Description, and then set the Severity of the alert that you want to generate, and then click on Add.

The trigger should then apply to any devices that are linked to the Template SNMP Generic template.

Share
May 042015
 

I’ve had some issues with some of my VMWare guests crashing for some odd reason.
The guests were my pfSense routers, so when they crashed, the house lost internet which was causing some issues as you could imagine!

Since I couldn’t work out why the guests kept crashing at first, I configured Zabbix to just reboot the virtual machines each time they went down so that the internet connectivity would be restored automatically. This meant that the emails that told me that my routers had crashed would actually be sent so that I would know that my internet had a hiccup, and for me to check to make sure any downloads I had running either finished properly, or that I had to redownload.

Zabbix has the ability to run remote commands on hosts via SSH, and my VMWare hosts had SSH enabled so I could run commands that I needed to reboot the hosts when the hosts went down.

Finding the VM

First thing I needed to do was to find the ID of the VM that I needed to reboot.
To get those, I needed to SSH onto my VM host and run the command vim-cmd vmsvc/getallvms | grep pfsense-2 which outputs this –
70 pfsense-2 [vmhost-500gb] pfsense-2/pfsense-2.vmx freebsd64Guest vmx-08 pfSense backup node
This command gave me the ID of 70 that I needed to use to reboot the VM from the command line.

Configuring the Zabbix Action

In order to run a command when a host went down, I created a new action to be run when a certain host goes down.
I used the following 3 conditions –
(A) Trigger value = PROBLEM
(B) Trigger = Template ICMP Ping: Template ICMP Ping is unavailable by ICMP
(C) Host = pfsense-2

This would make sure that the actions that run are only for the host that I have the ID for

In the Operations section of the action, I created a new step with the following settings –

Operation Type: Remote Command
Target : vmhost
Type : SSH
Username : root
Password : password
Port : 22
Commands : /bin/vim-cmd vmsvc/power.off 70 && /bin/vim-cmd vmsvc/power.on 70

The commands that I have used instructs VMWare to forcefully power off the VM with an ID of 70 – which in this case is my pfsense-2 guest, and then power it back on.

This was done on an ESX 5.1 host, but should work on anything newer as long as SSH is enabled.

Share
Apr 222015
 

I’ve wanted to get some temperature stats for some of my boxes for a while now to replace my aging Cacti install.
Since I already had Zabbix, that was the first place I looked for the functionality, however it does not have any templates set up out of the box, so I decided to set up my own templates for Temperature monitoring via SNMP.

I’m using Zabbix 2.2 at the moment, but the instructions should be applicable to 2.4 as well.
I’m using the Linux SNMP agent to get the temperature stats – the relevant packages on Debian are snmpd and lm-sensors.

First Things first

We need to install the snmp daemon if not already installed – apt-get install snmpd lm-sensors
After installing those the snmp daemon and lm-sensors, you may need to run sensors-detect to make sure the sensors are configured correctly.

Once the snmp daemon and lm-sensors is configured, running a snmpwalk for temperatures should result in something like this –

user@debian:~$ snmpwalk -v 2c -c public 127.0.0.1 1.3.6.1.4.1.2021.13.16.2
iso.3.6.1.4.1.2021.13.16.2.1.1.1 = INTEGER: 1
iso.3.6.1.4.1.2021.13.16.2.1.1.2 = INTEGER: 2
iso.3.6.1.4.1.2021.13.16.2.1.1.16 = INTEGER: 16
iso.3.6.1.4.1.2021.13.16.2.1.1.17 = INTEGER: 17
iso.3.6.1.4.1.2021.13.16.2.1.1.18 = INTEGER: 18
iso.3.6.1.4.1.2021.13.16.2.1.2.1 = STRING: "Core 0"
iso.3.6.1.4.1.2021.13.16.2.1.2.2 = STRING: "Core 1"
iso.3.6.1.4.1.2021.13.16.2.1.2.16 = STRING: "temp1"
iso.3.6.1.4.1.2021.13.16.2.1.2.17 = STRING: "temp2"
iso.3.6.1.4.1.2021.13.16.2.1.2.18 = STRING: "temp3"
iso.3.6.1.4.1.2021.13.16.2.1.3.1 = Gauge32: 39000
iso.3.6.1.4.1.2021.13.16.2.1.3.2 = Gauge32: 36000
iso.3.6.1.4.1.2021.13.16.2.1.3.16 = Gauge32: 39000
iso.3.6.1.4.1.2021.13.16.2.1.3.17 = Gauge32: 42000
iso.3.6.1.4.1.2021.13.16.2.1.3.18 = Gauge32: 4294965296

It looks like gibberish at a glance, but it’s actually telling us that it can detect 5 sensors.
The top 5 lines – the ones that have INTEGER are the identifiers for the sensors,
The next 5 lines – the ones that have STRING are the names of the sensors,
and the last 5 lines are the values of the sensors to 3 decimal places, just without the actual decimal point.

So that’s the Linux part all set up. On to Zabbix…

Zabbix Configuration

Regex

First up, we need to setup a RegEx to catch the sensors we want to monitor. In my case, I wanted to monitor all of them so I used the following regex which I named Sensors for Discovery –
^(temp[0-9]*|Core [0-9]*)$
The RegEx configuration is located in the Admin Tab, then drop down the menu on the right to get to “Regular expressions”

Template

Once that is done, we’ll need to create a new template. I’ve called mine “Template SNMP Sensors” and added it into the group “Templates”.
Create a new Discovery rule on the Template with the following settings
discovery rule

I’ve used {#SNMPVALUE} for the Macro, and @Sensors for Discovery for the Regexp.
You can use any value for the Key, that is a value internal to Zabbix.
And to save you some typing, the SNMP OID that is in the image is .1.3.6.1.4.1.2021.13.16.2.1.2

Item Prototype

Once the Discovery Rule is setup, you will need to create an Item prototype.
Here’s one I prepared earlier
item prototype

Again, the Key is internal to Zabbix, however the [{#SNMPVALUE}] is essential.
And again, here’s the SNMP OID to save some typing – .1.3.6.1.4.1.2021.13.16.2.1.3.{#SNMPINDEX}

Apply the Template

Once the Discovery and Item Prototype is setup, you’ll need to apply the template to a server in order for Zabbix to discover the sensors.
Once the sensors are discovered, they should show up in latest data with some values. The discovery itself may take a while unless you adjust the Interval on the Discovery Rule in the Template.
latest data

Share
Apr 162015
 

I’ve been setting up SNMP Traps on Zabbix 2.4 to replace our current in place monitoring solution.
One of the hurdles that I’ve come across is trying to get all the traps setup.

An easy way of doing this is getting the MIB files for the traps that you’re getting, and converting them into configuration files for SNMPTT to use to parse the traps.
The snmpttconvertmib command will take a MIB file as an input, and spit out a configuration file suitable for SNMPTT.
Using an Oracle MIB file as an example –

snmpttconvertmib --in=ORACLE-ENTERPRISE-MANAGER-4-MIB.mib --out=/etc/snmp/snmptt.conf.ora-em4

This will produce a file for SNMPTT but Zabbix will not parse the traps yet as the FORMAT line isn’t quite what we need yet.
Next, we’ll use sed to do a global search and replace to make sure the FORMAT lines conform to the format that Zabbix requires.

sed -i 's/FORMAT/FORMAT ZBXTRAP $aA/g' /etc/snmp/snmptt.conf.ora-em4

The configuration file then needs to be added to the list of files that SNMPTT uses to parse the traps.
Open /etc/snmp/snmptt.ini file – assuming it’s in the default location – and scroll right down to the bottom of the file.
You will see the following lines –

snmptt_conf_files = <<END
/etc/snmp/snmptt.conf

Add the file you’ve just created to the end like so –

snmptt_conf_files = <<END
/etc/snmp/snmptt.conf
/etc/snmp/snmptt.conf.ora-em4

And you should start getting SNMP traps appearing in Zabbix – assuming you’ve already set up the item.

Share