Jun 042015
 

So I got a bit sidetracked from my tear down of the Ritmo CE-3590 NAS, and ended up building a temperature sensor with some DS18B20s and a Raspberry Pi.

Today’s post will detail how I configured the Pi to output the temperature values to the SNMP agent that I’m running on the Pi.

Plugging The Sensors In

Since I used the DS18B20s, they are polled over a single wire with a 4K7 resistor across the VCC and Data wires.
I ended up using a whole bunch of CD Audio cables like this one –
CD Audio Cable
to create the wiring for the sensors. If I had the pins to use between the cables, I could have just joined cables together, but as I didn’t, I cut and soldered multiple cables together. At the end of the wires that will plug into the Pi, I spliced in the 4K7 resistor and heatshrinked it so hopefully it won’t short anything out.
Temp Sensor Wires
It ended up very messy, but it seems to have worked.

I used the Red wire for 3.3V, the white wire as data, and the black as ground.
Red then gets plugged into the Pi header at Pin 1 which is 3.3V power
White gets plugged into Pin 7 which is GPIO 4
Black gets plugged into Pin 6, which is a ground. This could be any of the other grounds, but this is the closest one.

Configuring the Pi

I’m using Raspbian on my Pi, so any instructions are done with a Raspbian flavour. Most distros should have the same setup though.
The Pi needs to be configured to use the w1-gpio device tree overlay (dtoverlay).
This is done by adding the line dtoverlay=w1-gpio to the end of the config.txt file on the /boot partition.
Once this dtoverlay has been activated, you should be able to see your sensors under /sys/devices/w1_bus_master1/. They should appear as 28-0215**. On my Pi, the sensors appear like so –

/sys/devices/w1_bus_master1/28-0215012018ff
/sys/devices/w1_bus_master1/28-021500ce50ff
/sys/devices/w1_bus_master1/28-021500cfceff

Catting one of the w1_slave nodes under the sensor should output something like this –

57 01 55 00 7f ff 0c 10 05 : crc=05 YES
57 01 55 00 7f ff 0c 10 05 t=21437

The YES confirms the sensor is working, and the temperature is displayed after the t=
In this example, the temperature is 21.437 Degrees Celsius. The output needs to be divided by 1000 to get the temperature to the correct amount of decimal places.

Configuring the SNMP agent

With the sensors plugged in, it’s time to extend the SNMP agent to allow us to poll the temperature sensors over SNMP.
I’ve written a script that will output just the temperature to the SNMP agent, I’ve placed this script in /opt/scripts but you’re free to put it wherever you want. You’ll need to keep the location handy for when we extend the SNMP agent.
I’ve named this script gettemp.sh

#!/bin/bash
#
# Usage: gettemp.sh
# e.g. gettemp.sh 28-0215012018ff
SENSOR=$1
SLAVE="/sys/devices/w1_bus_master1/"$SENSOR"/w1_slave"
OUTPUT=$(/bin/cat $SLAVE | /usr/bin/awk -F 't=' ' { printf $2 } ')
echo $OUTPUT

With this script, you should be able to call the script from a command line, and it should output the temperature for that sensor.

# /opt/scripts/gettemp.sh 28-021500ce50ff
21437

With this script operational, we’ll need to setup the SNMP agent to run this script to provide us the output of this script over SNMP.
To do this, we need to modify /etc/snmp/snmpd.conf. At the end of the file, put in this line –
Make sure you replace the sensor id with your own sensor id. If you want to monitor more than one sensor, add more extend lines, and give them differing names, like temp2, temp3, etc.

extend .1.3.6.1.3.1.1 temp1 /bin/bash /opt/scripts/gettemp.sh 28-021500ce50ff

After you modify the snmpd.conf file, make sure you restart SNMP agent with /etc/init.d/snmpd restart or service snmpd restart.

Once the SNMP agent is back up and running, you should be able to poll the OID we specified above (.1.3.6.1.3.1.1) and get the output of the command. I’ve run the snmpwalk on the Pi itself, polling itself.

# snmpwalk -v 2c -c public 127.0.0.1 .1.3.6.1.3.1.1
iso.3.6.1.3.1.1.1.0 = INTEGER: 1
iso.3.6.1.3.1.1.2.1.2.5.116.101.109.112.49 = STRING: "/bin/bash"
iso.3.6.1.3.1.1.2.1.3.5.116.101.109.112.49 = STRING: "/opt/scripts/gettemp.sh 28-021500ce50ff"
iso.3.6.1.3.1.1.2.1.4.5.116.101.109.112.49 = ""
iso.3.6.1.3.1.1.2.1.5.5.116.101.109.112.49 = INTEGER: 5
iso.3.6.1.3.1.1.2.1.6.5.116.101.109.112.49 = INTEGER: 1
iso.3.6.1.3.1.1.2.1.7.5.116.101.109.112.49 = INTEGER: 1
iso.3.6.1.3.1.1.2.1.20.5.116.101.109.112.49 = INTEGER: 4
iso.3.6.1.3.1.1.2.1.21.5.116.101.109.112.49 = INTEGER: 1
iso.3.6.1.3.1.1.3.1.1.5.116.101.109.112.49 = STRING: "21437"
iso.3.6.1.3.1.1.3.1.2.5.116.101.109.112.49 = STRING: "21437"
iso.3.6.1.3.1.1.3.1.3.5.116.101.109.112.49 = INTEGER: 1
iso.3.6.1.3.1.1.3.1.4.5.116.101.109.112.49 = INTEGER: 0
iso.3.6.1.3.1.1.4.1.2.5.116.101.109.112.49.1 = STRING: "21437"

As you can see from the example, the temperature is output in a couple of different places.
Polling the SNMP agent with one of those locations directly should yield only the temperature.

# snmpwalk -v 2c -c public 127.0.0.1 .1.3.6.1.3.1.1.4
iso.3.6.1.3.1.1.4.1.2.5.116.101.109.112.49.1 = STRING: "21437"

With that, we now have SNMP set up on the Pi, ready to be polled for the temperature.

Share
Jun 022015
 

I needed to get the average availability for a group of servers for some work that I was doing at my day job
These servers were monitored via both SNMP and ICMP, but I only needed to know if they were up or not.

To do that, I created a dummy host so I could set up items on it just for reporting purposes.
On this host, I created a new item of type “Zabbix aggregate”.
For the key, I used the grpavg[] function to average out the ICMP reachability metric for the group of servers. I set the time range for the last day to calculate

grpavg["Server Group","icmpping",last,1d]

I also set a % for the units, and the custom multiplier to 100. The result is a calculation of the average number of servers that are up for the period, in this case I’ve used the last 1 day.

Graphing this would then produce a graph of the average availability of the group “Server Group” for a day.

Share
May 252015
 

For my current task at work – moving away from CA Spectrum to Zabbix – I’ve had to integrate NMIS with Zabbix for SMS alerting as we wanted all alerts to filter through Zabbix for easy tracking of SMSes, and also for the ServiceNow integration functions that I have built into my Zabbix instance.

To build the integration between NMIS and Zabbix, I had to create a custom script that NMIS would call which would then send an SNMP trap to Zabbix for processing.

On the Zabbix side, I needed to set up snmptt to process the traps so that Zabbix will recognise them as traps and action them as alerts.

The following sections will detail the bits I’ve setup to get this integration working

NMIS Configuration

NMIS Alert Script

This script is what NMIS calls when an alert is generated.

I’ve named this script “snmptrap.pm”, it’s based off the example script in /usr/local/nmis8/lib/Notify on the appliance.
If you name it something different, make sure you update the relevant lines in the script file.

package Notify::snmptrap; ## Update this if you change the name

require 5;

use strict;

use vars qw(@ISA @EXPORT @EXPORT_OK %EXPORT_TAGS $VERSION);

use Exporter;
use JSON::XS;
use File::Path;
use Net::SNMP;

$VERSION = 1.00;

@ISA = qw(Exporter);

@EXPORT = qw(
snmptrap ## Update this if you change the name
);

@EXPORT_OK = qw( );

my $dir = "/tmp/customsnmptrap"; ## This is the log directory, and can also be changed

sub sendNotification {
my %arg = @_;
my $contact = $arg{contact};
my $event = $arg{event};
my $message = $arg{message};

my $trapdestination = "10.0.0.5"; ## This should be your Zabbix server IP Address
my $trapcommunity = "public"; # Use your community string here
my $oid = "1.3.6.1.4.1.4818.1"; # I've used the OPMANTEK MIB OID here, but you can use your own if you want

if ( not -d $dir ) {
my $permission = "0770";

my $umask = umask(0);
mkpath($dir,{verbose => 0, mode => oct($permission)});
umask($umask);
}

# add the time now to the event data.
$event->{time} = time;

$event->{email} = $contact->{Email};
$event->{mobile} = $contact->{Mobile};

my ($sess, $err) = Net::SNMP->session(
-hostname => $trapdestination,
-version => 1, #trap() requires v1
-port => 162
);

if (!defined $sess) {
print "Error connecting to target ". $trapdestination . ": ". $err;
next;
}

my @vars = qw();
my $varcounter = 1;

push (@vars, $oid . '.' . $varcounter);
push (@vars, OCTET_STRING);

# This is where you set up the variables for the SNMP Trap message
push (@vars,$event->{level}.' : '.$event->{node}.' : '.$event->{element}.' : '.$event->{event});

my $result = $sess->trap(
-varbindlist => \@vars,
-enterprise => $oid,
-specifictrap => 1,
);

if (! $result)
{
print "An error occurred sending the trap: " . $sess->error();
}

my $fcount = 1;
my $file ="$dir/$event->{startdate}-$fcount.json";
while ( -f $file ) {
++$fcount;
$file ="$dir/$event->{startdate}-$fcount.json";
}

my $mylog;
$mylog->{contact} = $contact;
$mylog->{event} = $event;
$mylog->{message} = $message;

open(LOG,">$file") or logMsg("ERROR, can not write to $file");
print LOG JSON::XS->new->pretty(1)->encode($mylog);
close LOG;
# good to set permissions on file.....
}
1;

NMIS Alert Configuration

Now NMIS needs to be setup to call the new snmptrap.pm script when an alert is generated.
To setup NMIS, you’ll need to locate the escalation that requires the SNMP trap.
Open the escalations table by going to Setup --> Emails, Notifications and Escalation.
In the escalation table, find the alert that you need SNMP traps for, and add this to the escalation level that requires traps –
snmptrap:Contact – Replace Contact with a contact in NMIS.

Zabbix Configuration

Once NMIS has been setup to send traps to the Zabbix server, some configuration needs to be done on the Zabbix side.

SNMPTT Configuration

You’ll need to set up SNMPTT to receive SNMP traps from the OID you’re using in the snmptrap script.
In this example, I’m just going to set up a catchall to catch the SNMP traps, however you can use SNMPTT to parse different traps and generate different alerts.

Create a file in /etc/snmp called snmptt.conf.catch
In that file, put the following lines in
EVENT general .* "SNMP Catchall" Normal
FORMAT ZBXTRAP $aA $ar

You’ll also need to modify /etc/snmp/snmptt.ini to add the newly created file to the snmptt_conf_files configuration variable.
This can be done by appending the path to the list like this –

snmptt_conf_files = <<END
/etc/snmp/snmptt.conf.catch
END

If there are already lines there, then add the line to the block of text right before the last END

Zabbix Item Configuration

I’ve used the basic snmptrap.fallback method to catch all traps, but you can set up specific alerts in SNMPTT to generate different messages.
On the NMIS server, add an item of type SNMP Trap, and with a key of snmptrap.fallback.
This item will now get any SNMP traps from the Server, you can create a trigger if required to alarm on the SNMP traps, or just keep them for history.

Share
May 182015
 

One of my current projects at work is to build up Zabbix as an alerting solution.
This includes using Zabbix to raise incidents in ServiceNow for any alerts that come through.

Initially, I thought that I would need to do lots of scripting, but it turns out I only had to write a simple script to allow Zabbix to raise incidents in ServiceNow.
This was largely thanks to pre-built Python modules that the community have built to allow easy integrations, namely ZabbixAPI and Python-Servicenow.

These 2 libraries made integration easy because they allowed me to concentrate more on the code to join the 2 systems rather than having to figure out how to make them talk to Python, and then talk to each other.

The integration itself will take an alert that is generated by Zabbix and insert the data into ServiceNow as an incident.

Configuring Zabbix

  1. Copy the snippet at the bottom of this post into a file in /usr/lib/zabbix/alertscripts. I’ve named mine servicenowapi.py.
  2. Create a new Media Type.
    Create a new media type by going to Administration => Media types, and click on Create media type.
    Give the Media Type a name, select Script for the Type, and put in the name of the file. Using my example, it would be servicenowapi.py
  3. Assign the new Media Type to a user.
    The user’s “Send to” for the media type will define the assignment group in ServiceNow.
    Click on Administration => Users, select Users in the drop down on the top right, and click on a user. Once you’re in the user’s configuration page, click on the Media tab, and then click on ‘Add’.
    Select the new Media Type from the type drop down, and then enter in the ServiceNow Assignment Group in the ‘Send To’ box, and click ‘Add’.
  4. Create or modify an existing action to start sending incidents to ServiceNow.
    Click on Configuration => Actions, and open up an Action. Click on the Operations Tab, and click on “New”.
    Click on “Add” in the Send To Users section, and choose the user that has the ServiceNow Media type set up.
    Select the ServiceNow action in the “Send only to” box, and then click on the “Add” button to add the action to the list of actions.
    Once the action has been setup, click on Save.

Once the alert is all set up, whenever the alert is triggered, the script should log an incident directly into ServiceNow.

servicenowapi.py

The below code should be copied and pasted into a file to be used as the script for the Media Type.

#!/usr/bin/python
import zapi
import datetime
import sys
import urllib2
import os
import servicenow.Connection
import servicenow.ServiceNow

##
## I've used logging for my own setup, but I've commented it out so that it won't spam a log file unless you uncomment it.
## Just make sure the location that you're storing the logfile is writable by the zabbix user
## In this example, I've used /usr/lib/zabbix/logfiles but this could be anywhere writable by the zabbix user
#f = open('/usr/lib/zabbix/logfiles/snow.log','a')
#f.write('\n\nScript Start :: '+datetime.datetime.now().ctime()+'\n\n')
#f.write(','.join(sys.argv)+'\n')

## Zabbix Passes the details via command line arguments.
assignmentgroup = sys.argv[1]
description = sys.argv[2]
detail = sys.argv[3]

## Set Up your Zabbix details
zabbixsrv = "127.0.0.1"
zabbixun = "Admin"
zabbixpw = "zabbix"

## Set up your ServiceNow instance details
## For Dublin+ instances, connect using JSONv2, otherwise use JSON
username = "username"
password = "password"
instance = "instance"
api = "JSONv2"

## I've configured Zabbix to only pass the Event ID in the message body.
## If you want more detail in the body of the incident in ServiceNow, you'll need to make sure that eventid is parsed out of detail correctly.
eventid = detail

#f.write('trying to connect to servicenow\n')
try:
conn = servicenow.Connection.Auth(username=username,password=password,instance=instance, api=api)
except:
print "Error Connecting to ServiceNow\n"
#f.write("Error Connecting to ServiceNow\n")

#f.write('trying to create incident instance\n')
try:
inc = servicenow.ServiceNow.Incident(conn)
except:
print "Error creating incident instance\n"
#f.write("Error creating incident instance\n")

#f.write('trying to create new incident\n')

## This is where the fun starts.
## You'll need to set up the following section with the correct form fields, as well as the default values
try:
newinc = servicenow.ServiceNow.Incident.create(inc, { \
"short_description":description, \
"description":detail, \
"priority":"3", \
"u_requestor":"autoalert", \
"u_contact_type":"Auto Monitoring", \
"assignment_group": assignmentgroup})
#f.write("\n\n"+str(newinc)+"\n\n")
except Exception as e:
print "Error creating new incident in ServiceNow\n"
print str(e)
#f.write("Error creating new incident in ServiceNow\n")
#f.write(str(e)+"\n")

## This script will retrieve the new incident number from servicenow and put it back into zabbix as an acknowledgement
try:
newincno = newinc["records"][0]["number"]
except:
print "unable to retrieve new incident number\n"
#f.write("unable to retrieve new incident number\n")

zabbix = zapi.ZabbixAPI(url='http://'+zabbixsrv+'/zabbix',user=zabbixun,password=zabbixpw)
zabbix.login()
#f.write('Acknowledging event '+eventid+'\n')
zabbix.Event.acknowledge({'eventids':[eventid],'message':newincno})

#f.write('\n\nScript End :: '+datetime.datetime.now().ctime()+'\n\n')
#f.close()

Share
May 112015
 

I never noticed this before since I didn’t use Zabbix for production monitoring, but Zabbix out of the box does not have any alerts set up to tell you that an SNMP agent is unresponsive.
This isn’t an issue if you’re doing monitoring using the Zabbix Agent, or just monitoring server ups and downs, but when you’re using Zabbix to gather metrics such as CPU and Memory usage, this can become an issue.

The solution is to create a trigger for SNMP hosts to alert when Zabbix does not get any data for more than a certain amount of time.

Creating the trigger

I’ve chosen to create the trigger on the Template SNMP Generic template so that all SNMP devices will get this trigger.
To create the trigger, click on Configuration ==> Templates, and then find Template SNMP Generic. To the right, click on Triggers
Once the Triggers page has loaded, click on Create Trigger in the top right.
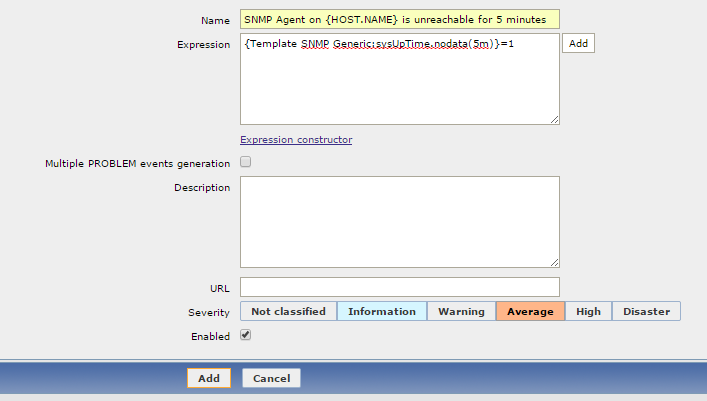
Give the trigger a name, and use the following Expression {Template SNMP Generic:sysUpTime.nodata(5m)}=1
Trigger Configuration
Optionally, give it a Description, and then set the Severity of the alert that you want to generate, and then click on Add.

The trigger should then apply to any devices that are linked to the Template SNMP Generic template.

Share