My last electricity bill that I received seemed very very high so I’ve decided to try and monitor my home’s power usage, and as an added bonus, I can also start IoT-ing my house.
I purchased one of these – an Ankuoo Wifi Controlled Power Meter and Socket – to start off with so I can determine the power usage of specific appliances. Later on, I’ll also get a full house power monitoring system, but I wanted to start off small so I can determine how much power usage I’m incurring for things like leasving my TV on standby.
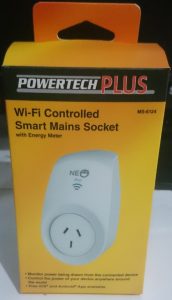
Typical Jaycar Packaging
The power point is very easy to setup, just a matter of downloading the App from the Play store, plugging the socket in, and connecting the socket to the wifi network.
There’s a few downsides with this particular plug though. One is that it only connects to a 2.4ghz network, and two is that it’s quite a bulky unit. I’ve plugged it into a dual GPO and the other side is fairly well blocked off unless I’m plugging in a thin power plug.
Once the wifi network is connected, it’ll show up on the app and you’ll be able to turn the powerpoint on/off by touching the power icon.
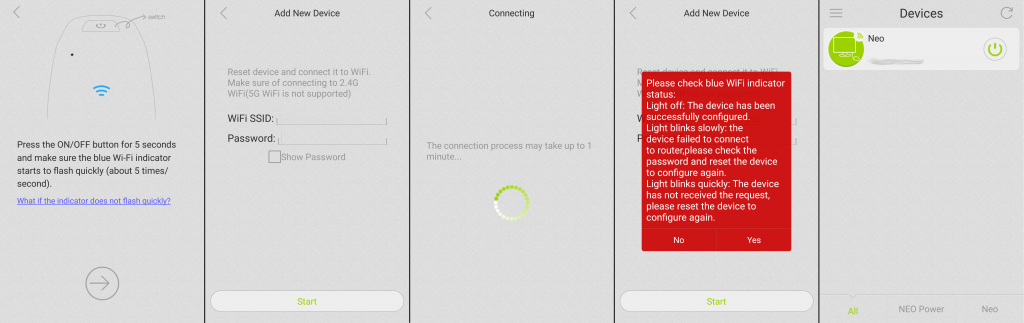
Going through the App Setup. I had the wrong WiFI passphrase first, but then it connected pretty quickly.
When you touch the icon for the power point, you are taken to a configuration page where you can set the timers, check the energy info, set the visibility status, and also change the settings for the device. The power button on the right will turn the powerpoint on and off.
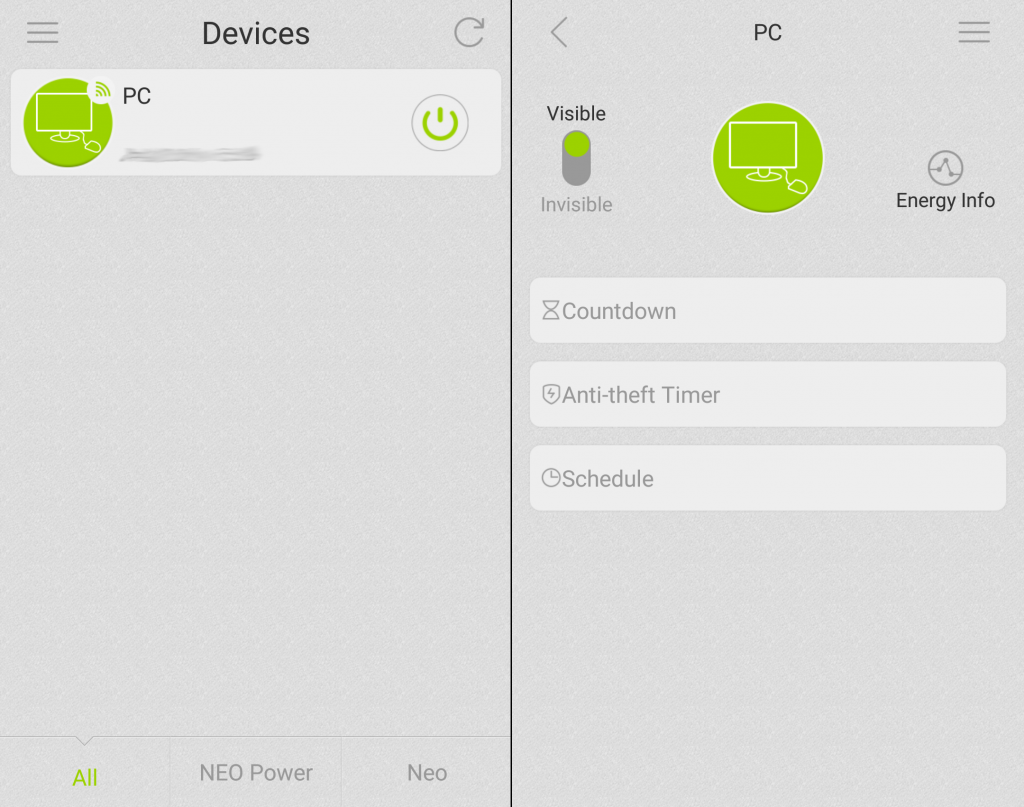
On the left we have the Menu that the Powerpoint appears in, and on the right we have the configuration page for the Power Point. The settings button can be seen on the top right of the image.
The settings button that is located in the top right takes you to the settings page.
Settings
This is where you set the name, icon, and also allows you to do a firmware update for the power point.
You are able to take a photo to use as an icon for devices that aren’t represented by the included icons.
There is also a button in the top right to do a firmware update for the device.
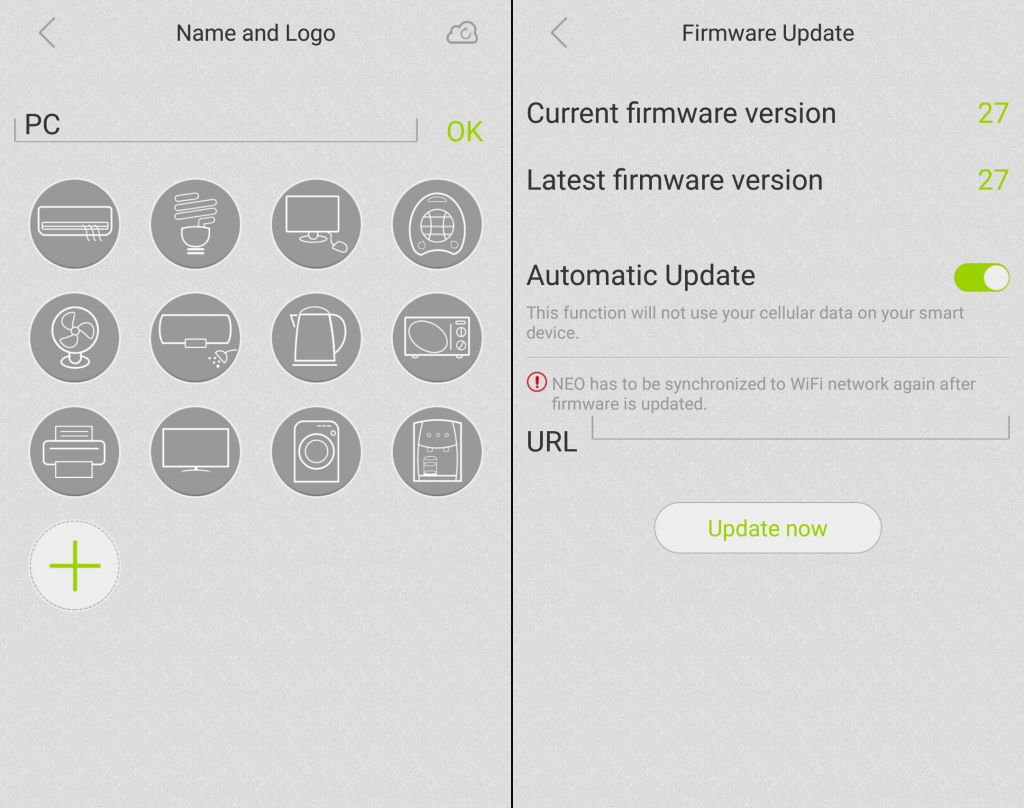
Settings screen on the left shows the different icons available. The firmware screen on the right shows current and latest firmware.
Timers
There are 3 timers that are available which allow you to set countdowns, set a schedule, or set the ‘Anti-Theft’ timer.
The countdown allows you to turn the power point on or off after a certain amount of time after setting the countdown.
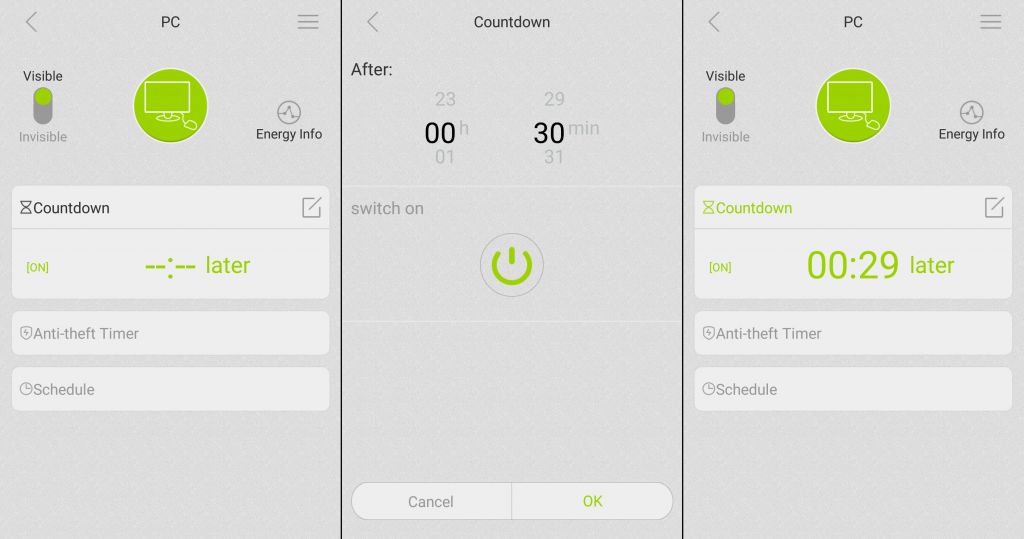
The countdown is configured with timer, and an on or off option. After setting it, you’ll see the countdown timer when the Countdown section is expanded
A long touch on the timer will allow you to delete the countdown timer that you have set.
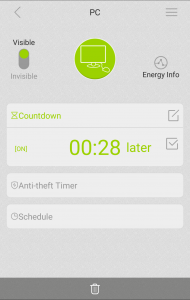
Ticking the box and touching the rubbish bin at the bottom deletes the timer
The schedule timer allows you to set up times and days for the timer to turn on or off.
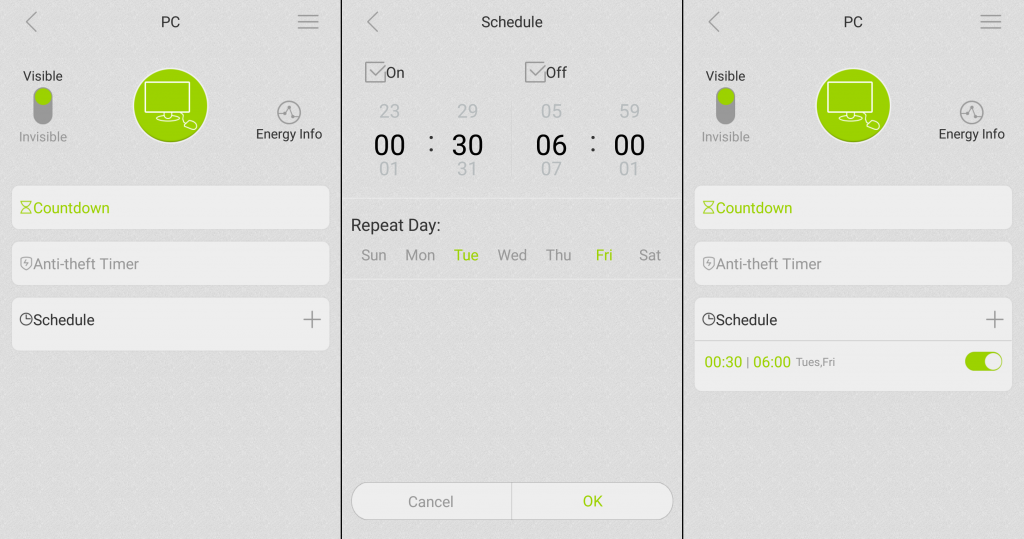
In this series of screenshots, I’ve setup a schedule to turn on at 12:30 AM and turn off at 6 AM only on Tuesdays and Fridays. More than one schedule can be setup, and can also overlap on times and/or days.
The Anti-theft timer is the interesting timer though. This lets you set a timeframe within the days you set to randomly turn the powerpoint on or off for up to 8 times.
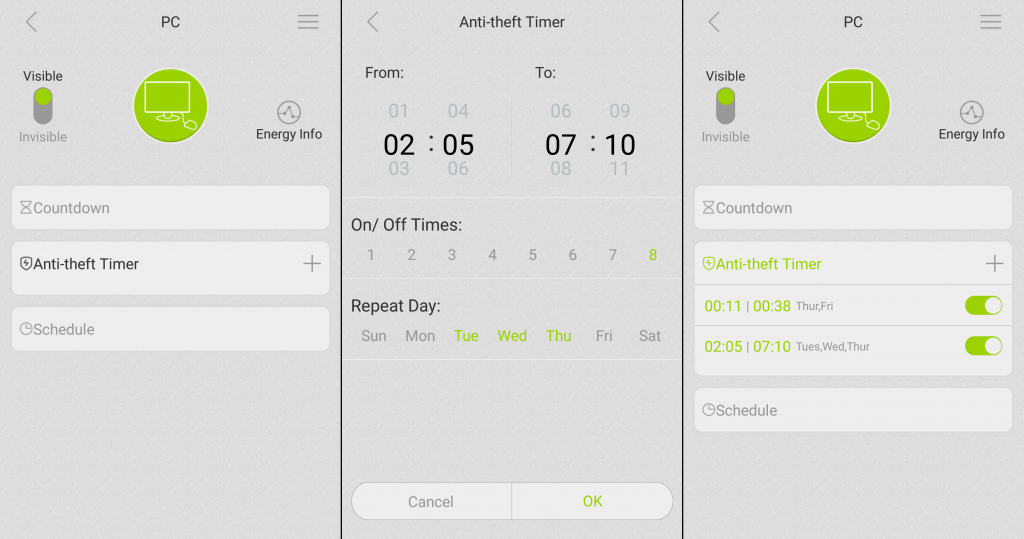
In this one, I’ve set up something to turn on and off 8 times from between 2:05AM and 7:10AM on Tuesdays, Wednesdays, and Thursdays.
You can also see the second schedule I’ve set which only does it on Thursday and Friday between 12:11AM And 12:38AM.
That means that you could attach lights or a hifi system to the powerpoint and have them power on at random times so that it appears that someone is home.
Energy Monitoring
The Energy info button brings up the power usage screens. The first screen is a real-time consumption screen which shows you the current real time consumption, the time the power point has been on for, and total consumption and cost for the period it’s been on for. Hitting the cog on the top right also allows you to set the price per kWh used to allow the app to approximate costs for your electricity usage.
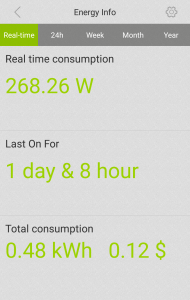
The Real Time power monitoring gives you an idea of how much you’re using right now and have used since you turned the device on.
The 24 hour, Week, Month, and Year screens all show power usage over the period selected with a line graph, again with the time it’s been on for, energy consumption, and cost.
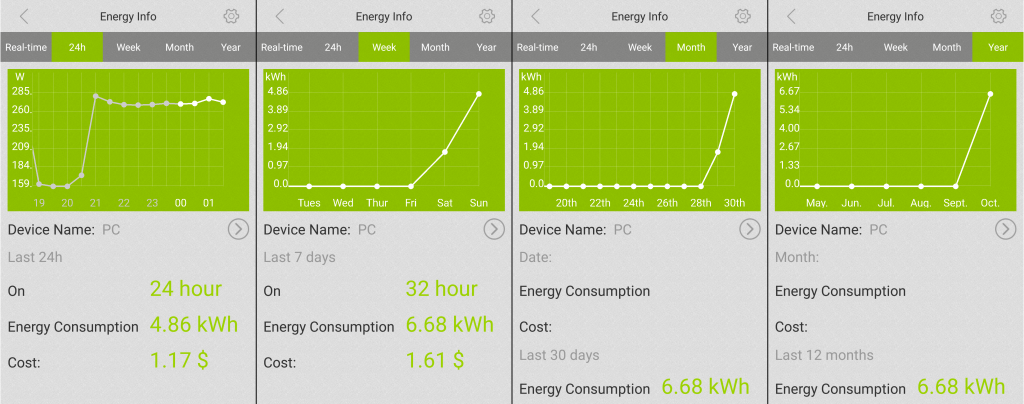
These graphs show the power usage over the last 24 hours, Week, Month, and Year. The 24 hour and Weekly history shows costs for the relevant period.
On all of the line graphs, you can touch the data points on the line to see more information.
The 24 hour graph shows current usage for the past hour, while the weekly graph shows kWh used for each day.
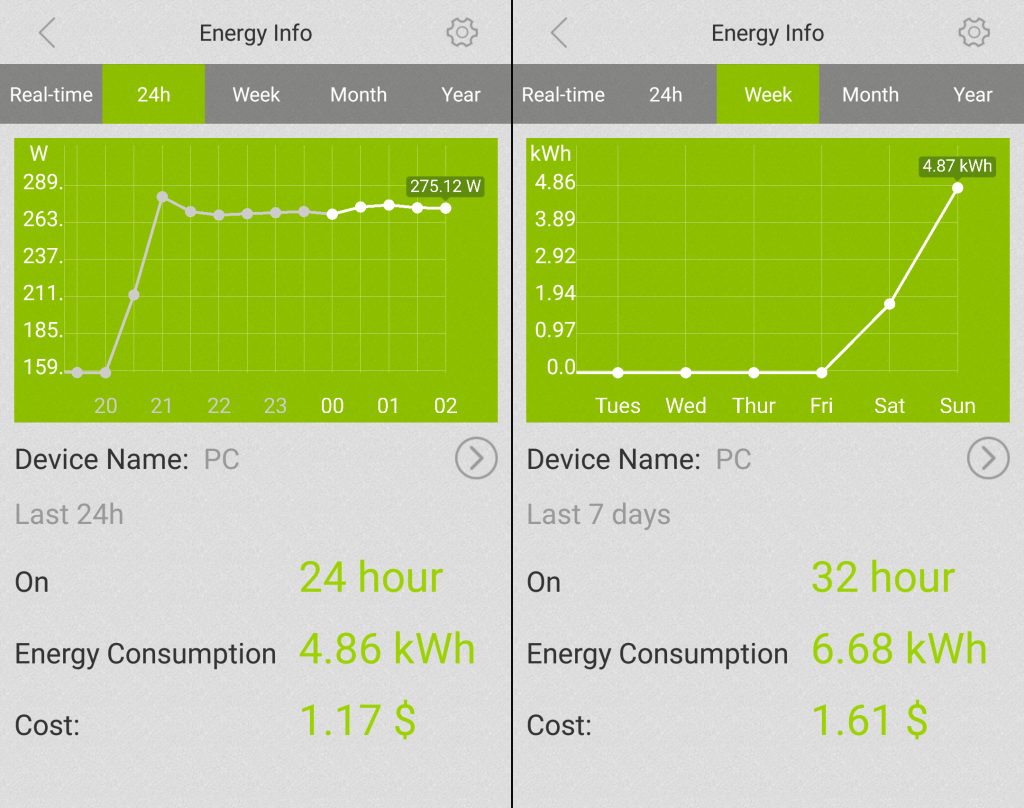
The 24 Hour and Weekly graphs show usage information for the period.
On the Monthly and Yearly graphs, selecting the datapoint will populate the fields under the line graph with more information about the data point, as well as show the information for the period selected.
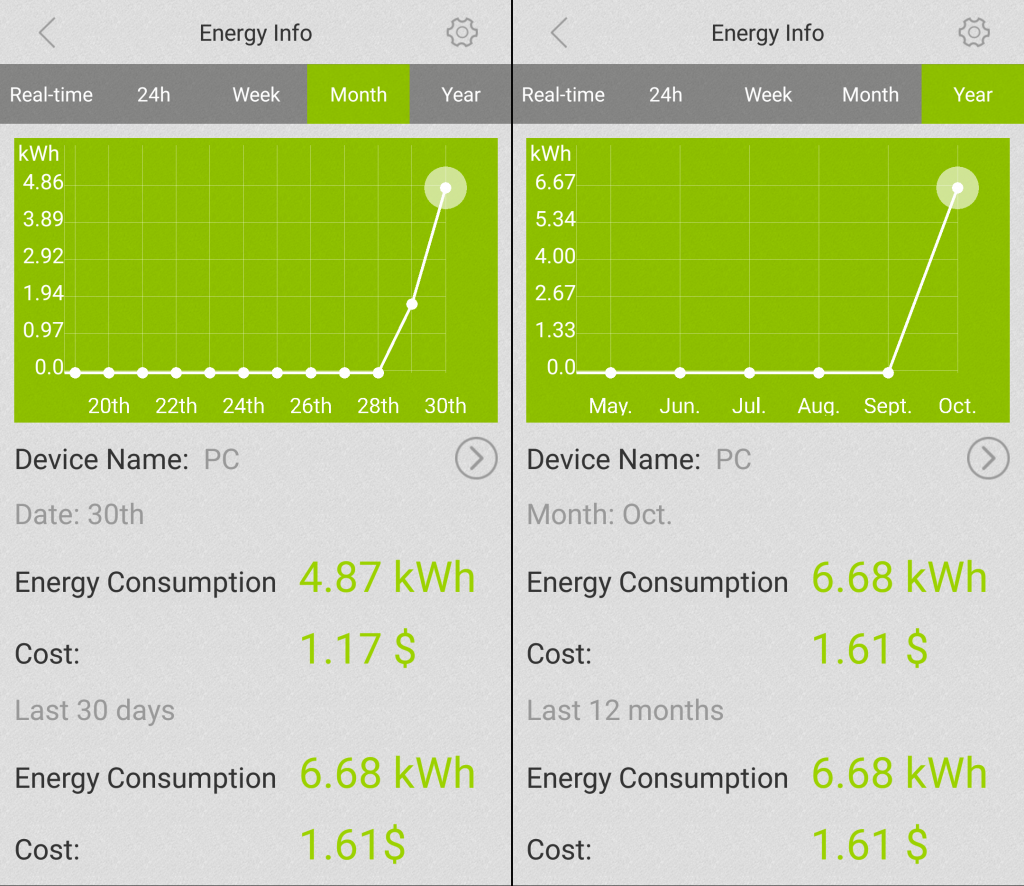
The Monthly and Yearly graphs show data for the point itself as well as for the period selected.
Conclusion
This power meter does what it advertises. You can see power usage, turn the device on and off from both inside your network and outside, has timers, and has an App.
The ability to switch the power point on or off remotely or by a schedule gives the users the ability to automate items around the house to make life easier for them. This particular power point also has the ability to simulate human activity so that an intruder may think that someone is home while the owner is out and about.
I’ll be having a look at the more technical details at another time, but for the energy conscious user, this device can help by letting you know how much you’re spending by keeping things on, or on standby.
